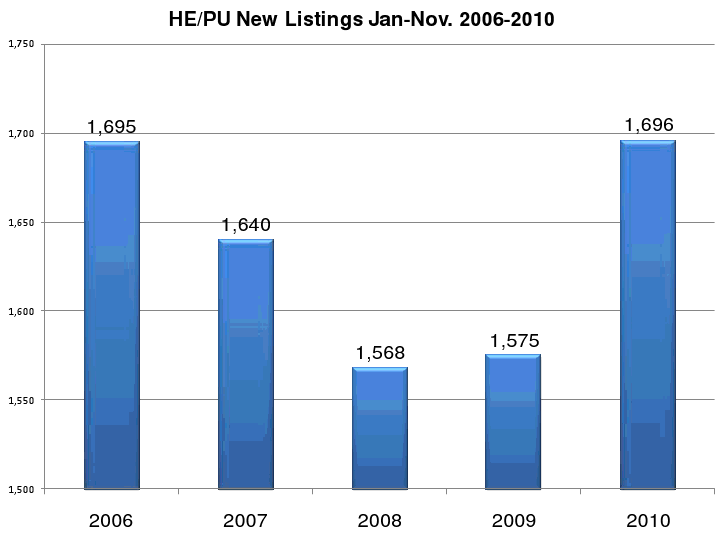
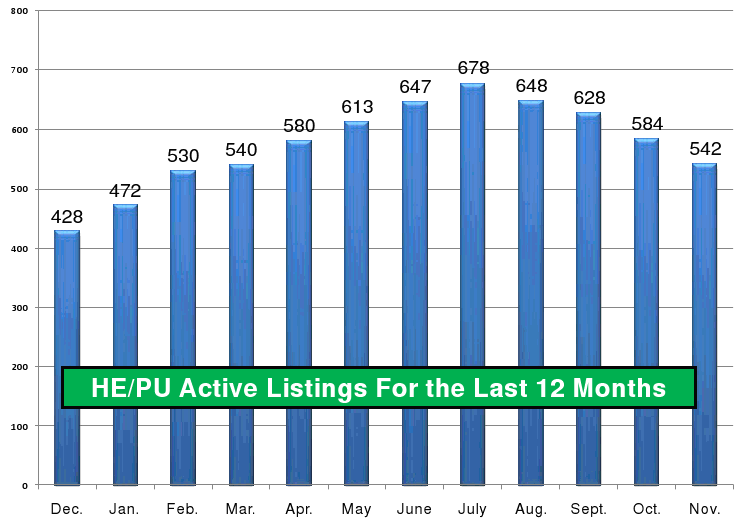
Here are some very resourceful graphs showing a picture of the Santa Barbara real estate market. These statistics were published through the Santa Barbara MLS on December 3rd.
He/PU=Home or PUD (Planned Unit Development)
CO=condo
All graphs run from the beginning of January through the end of November.
It's clear from these graphs that 2008 was our lowest performing year, we are seeing an uptick in the market, and prices are still low. There should be some good opportunities in 2011.


No comments:
Post a Comment